Multiple Choice
The table below shows the quantities of automobiles, margarine, and coffee purchased by Ted at different levels of income.Table 6.2
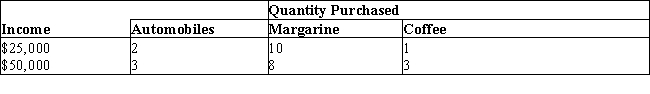
-Arc elasticity is calculated as _____.
A) 
B) 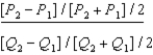
C) 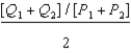
D) 
E) 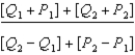
Correct Answer:

Verified
Correct Answer:
Verified
Related Questions
Q77: Figure 5.3. The figure shows the wage
Q78: Scenario 5.1<br>The demand for noodles is given
Q79: Scenario 5.1<br>The demand for noodles is given
Q80: The figure given below shows the demand
Q81: The figure given below shows the demand
Q83: Scenario 5.1<br>The demand for noodles is given
Q84: The figure given below shows the demand
Q85: Scenario 5.1<br>The demand for noodles is given
Q86: Scenario 5.1<br>The demand for noodles is given
Q87: Figure 5.3. The figure shows the wage