Multiple Choice
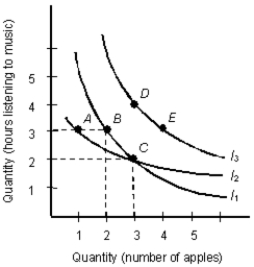
The below indifference map shows the various combinations of hours of music and apples that yield different levels of utility.Figure 7.1
-Which of the following will most likely happen when a person's income increases, other things equal?
A) The budget line will shift outward
B) The budget line will become steeper
C) The budget line will become flatter
D) The indifference curves will shift outward
E) The indifference curves will shift downward
Correct Answer:

Verified
Correct Answer:
Verified
Q72: The below figure shows the various combinations
Q73: The table below shows the total utility
Q74: The table given below depicts the total
Q75: Scenario 5.1<br>The demand for noodles is given
Q76: The table given below records the total
Q78: The below figure shows the various combinations
Q79: The table below shows the total utility
Q80: Scenario 5.1<br>The demand for noodles is given
Q81: The table given below reports the total
Q82: The below figure shows the various combinations