Multiple Choice
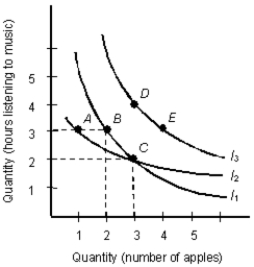
The below indifference map shows the various combinations of hours of music and apples that yield different levels of utility.Figure 7.1
-An increase in income _____.
A) makes the budget line flatter
B) makes the budget line steeper
C) makes the consumer worse off
D) makes the consumer achieve a higher level of utility
E) makes the consumer more selfish
Correct Answer:

Verified
Correct Answer:
Verified
Q27: The below figure shows the various combinations
Q28: The below table shows the average utility
Q29: The table below shows the total utility
Q30: Scenario 5.1<br>The demand for noodles is given
Q32: The below table shows the average utility
Q33: The table given below reports the total
Q34: The below figure shows the various combinations
Q35: The table given below depicts the total
Q36: Scenario 5.1<br>The demand for noodles is given
Q96: The table below shows the total utility