True/False
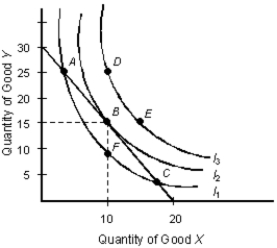
The below figure shows the various combinations of the goods X and Y that yield different levels of utility.Figure 7.3

-The theory of bounded rationality states that it is likely for consumers to have perfect information.
Correct Answer:

Verified
Correct Answer:
Verified
Related Questions
Q101: The table below shows the total utility
Q102: The table given below depicts the total
Q103: The below table shows the average utility
Q104: The table below shows the total utility
Q105: Scenario 5.1<br>The demand for noodles is given
Q107: Scenario 5.1<br>The demand for noodles is given
Q108: Scenario 5.1<br>The demand for noodles is given
Q109: The below table shows the average utility
Q110: The below figure shows the various combinations
Q111: The table below shows the total utility