Multiple Choice
The following graph shows the marginal revenue (MR) and marginal cost (MC) curves of an imperfectly competitive firm.Figure 9.2
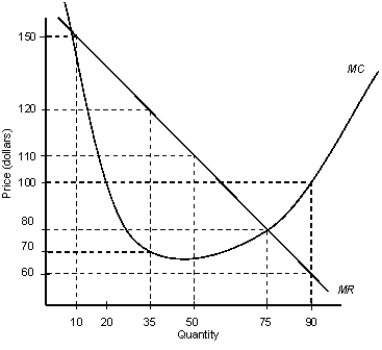
-Refer to Figure 9.2. At a quantity of 10 units, the firm should _____ , and at a quantity of 75 units, the firm should _____.
A) leave the level of production unchanged; also leave production unchanged
B) leave the level of production unchanged; decrease production
C) increase production; decrease production
D) increase production; leave production unchanged
E) decrease production; increase production
Correct Answer:

Verified
Correct Answer:
Verified
Q1: Scenario 9.2<br>Consider a publicly held firm (one
Q3: Scenario 9.1<br>Jane left her job at Siemens
Q4: The table given below reports the marginal
Q5: The figure given below shows three Short
Q6: Scenario 9.2<br>Consider a publicly held firm (one
Q7: The figure given below shows the revenue
Q8: The table given below reports the marginal
Q9: Scenario 9.2<br>Consider a publicly held firm (one
Q10: Scenario 9.2<br>Consider a publicly held firm (one
Q11: The figure given below shows the revenue