Multiple Choice
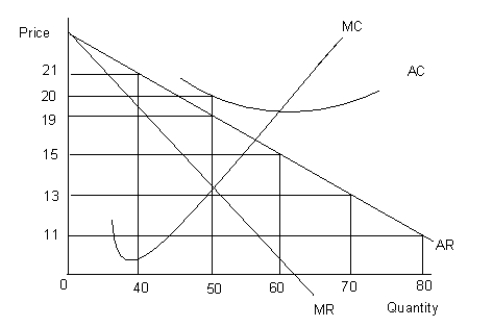
The figure given below shows the revenue and cost curves of a firm. MC represents the marginal cost curve, AC the average cost curve, MR the marginal revenue curve, and AR the average revenue curve.Figure 9.4

-Which among the following does not determine the shape of the demand curve for a good under different market structures?
A) Number of substitutes in the market
B) Importance of the good in a consumer's budget
C) Cost structure of the firm
D) Price-elasticity of demand
E) The length of time being considered
Correct Answer:

Verified
Correct Answer:
Verified
Q102: Scenario 9.1<br>Jane left her job at Siemens
Q103: Scenario 9.2<br>Consider a publicly held firm (one
Q104: The table given below reports the marginal
Q105: The figure given below shows the cost
Q106: The figure given below shows three Short
Q108: The table given below reports the marginal
Q109: The table given below reports the marginal
Q110: Scenario 9.2<br>Consider a publicly held firm (one
Q111: The figure given below shows the revenue
Q112: The table given below reports the marginal