Multiple Choice
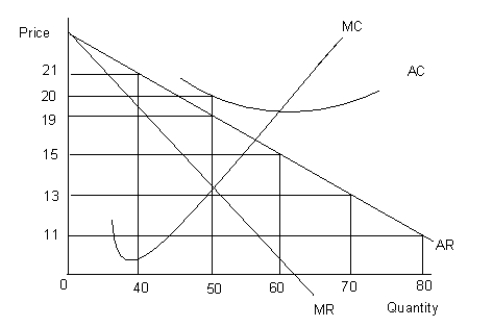
The figure given below shows the revenue and cost curves of a firm. MC represents the marginal cost curve, AC the average cost curve, MR the marginal revenue curve, and AR the average revenue curve.Figure 9.4

-An industry which has no barriers to entry, no product-promotion strategy, a standardized product, and a very large number of firms operating within it, is said to have:
A) a monopoly market structure.
B) perfect competition.
C) monopsonistic competition.
D) monopolistic competition.
E) an oligopoly market structure.
Correct Answer:

Verified
Correct Answer:
Verified
Q67: Scenario 9.2<br>Consider a publicly held firm (one
Q68: Scenario 9.2<br>Consider a publicly held firm (one
Q69: Scenario 9.2<br>Consider a publicly held firm (one
Q70: The table given below reports the marginal
Q71: The table given below reports the marginal
Q73: The figure given below shows the revenue
Q74: The following figure shows the cost and
Q75: Scenario 9.1<br>Jane left her job at Siemens
Q76: Scenario 9.2<br>Consider a publicly held firm (one
Q77: Scenario 9.2<br>Consider a publicly held firm (one