Multiple Choice
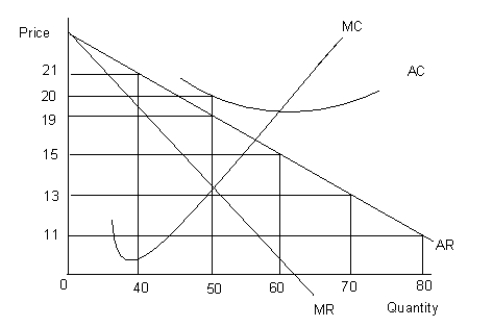
The figure given below shows the revenue and cost curves of a firm. MC represents the marginal cost curve, AC the average cost curve, MR the marginal revenue curve, and AR the average revenue curve.Figure 9.4

-Why does a monopolist face the market demand curve?
A) Presence of a large number of substitutes
B) Presence of a large number of buyers in the market
C) Barred entry of any new firm in the market
D) Produces a homogeneous product
E) Consumers have perfect knowledge of the market
Correct Answer:

Verified
Correct Answer:
Verified
Q90: Scenario 9.2<br>Consider a publicly held firm (one
Q91: The figure given below shows the revenue
Q92: Scenario 9.2<br>Consider a publicly held firm (one
Q93: The figure given below shows the cost
Q94: Scenario 9.2<br>Consider a publicly held firm (one
Q96: The table given below shows the total
Q97: Scenario 9.2<br>Consider a publicly held firm (one
Q98: The table given below reports the marginal
Q99: The table given below reports the marginal
Q100: Scenario 9.2<br>Consider a publicly held firm (one