Multiple Choice
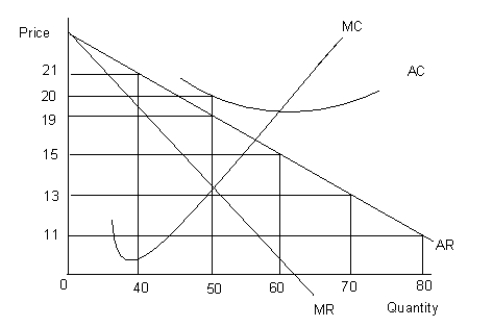
The figure given below shows the revenue and cost curves of a firm. MC represents the marginal cost curve, AC the average cost curve, MR the marginal revenue curve, and AR the average revenue curve.Figure 9.4

-Under imperfect competition, a firm's:
A) demand curve lies below its marginal revenue curve.
B) demand curve lies above its marginal revenue curve.
C) demand curve coincides with its marginal revenue curve.
D) demand curve coincides with its marginal cost curve.
E) demand curve coincides with its average cost curve.
Correct Answer:

Verified
Correct Answer:
Verified
Q108: The table given below reports the marginal
Q109: The table given below reports the marginal
Q110: Scenario 9.2<br>Consider a publicly held firm (one
Q111: The figure given below shows the revenue
Q112: The table given below reports the marginal
Q114: The table given below reports the marginal
Q115: The table given below reports the marginal
Q116: The table given below reports the marginal
Q117: Scenario 9.1<br>Jane left her job at Siemens
Q118: The table given below shows the total