Multiple Choice
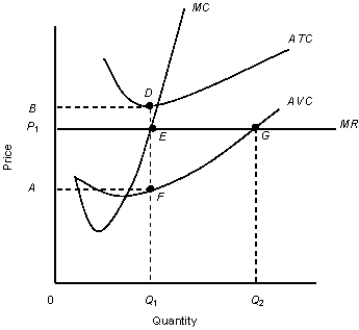
The figure given below shows the revenue and cost curves of a perfectly competitive firm.Figure 10.5
 MC: Marginal cost curve
MR: Marginal revenue curve.ATC: Average-total-cost curve
AVC: Average-variable-cost curve
-A perfectly competitive firm's supply curve is the portion of the:
A) TC curve that lies above the TR curve.
B) MR curve that lies above the MC curve.
C) AFC curve that lies above the AR curve.
D) AVC curve that lies above the ATC curve.
E) MC curve that lies above the AVC curve.
Correct Answer:

Verified
Correct Answer:
Verified
Q120: The following figure shows equilibrium at the
Q121: Scenario 9.2<br>Consider a publicly held firm (one
Q122: Scenario 9.2<br>Consider a publicly held firm (one
Q123: The figure given below shows the demand
Q124: The figure given below shows the revenue
Q126: The table given below shows the total
Q127: The figure given below shows the aggregate
Q128: The figure given below shows the aggregate
Q129: The figure given below shows the revenue
Q130: The figure given below shows the aggregate