Multiple Choice
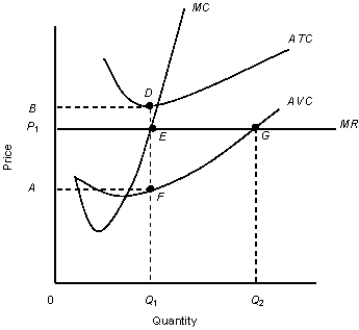
The figure given below shows the revenue and cost curves of a perfectly competitive firm.Figure 10.5
 MC: Marginal cost curve
MR: Marginal revenue curve.ATC: Average-total-cost curve
AVC: Average-variable-cost curve
-What causes the market supply curve to shift rightward?
A) Increase in the aggregate demand
B) Decrease in the number of existing firms
C) Decrease in the price level
D) Increase in the cost of production
E) Entry of new firms
Correct Answer:

Verified
Correct Answer:
Verified
Q10: The figure given below shows the aggregate
Q11: The figure given below shows the aggregate
Q12: Scenario 9.2<br>Consider a publicly held firm (one
Q13: The figure given below shows the revenue
Q14: The figure given below shows the revenue
Q16: Scenario 9.2<br>Consider a publicly held firm (one
Q17: Scenario 9.2<br>Consider a publicly held firm (one
Q18: The figure given below shows the demand
Q19: The figure given below shows the aggregate
Q20: The figure given below shows the aggregate