True/False
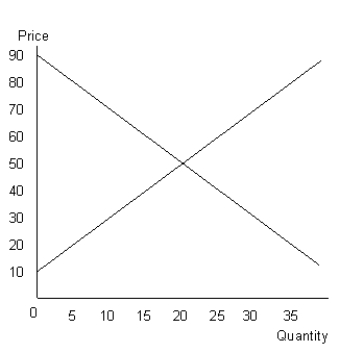
The figure given below shows the aggregate demand and supply curves of a perfectly competitive market.Figure 10.7

-Given a perfectly competitive market structure at the profit-maximizing output level, a firm's total fixed cost is $15, total variable cost is $137, marginal revenue is $4, and the quantity demanded is 65. The total profit earned by the firm is $108.
Correct Answer:

Verified
Correct Answer:
Verified
Q111: The following figure shows equilibrium at the
Q112: Scenario 9.2<br>Consider a publicly held firm (one
Q113: The table given below shows the total
Q114: The figure given below shows the aggregate
Q115: The table given below shows the price
Q117: The figure given below shows the revenue
Q118: The figure given below shows the revenue
Q119: The figure given below shows the revenue
Q120: The following figure shows equilibrium at the
Q121: Scenario 9.2<br>Consider a publicly held firm (one