Multiple Choice
The figure given below shows the demand curves of two classes of buyers, for tickets to a football match.Figure 11.4
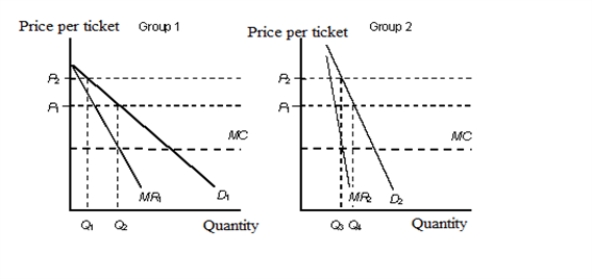 D1: Demand curve of group 1
D2: Demand curve of group 2
MR1: Marginal revenue of group 1
MR2: Marginal revenue of group 2
MC: Marginal cost
-In Figure 11.4, the demand curve D2:
A) has a price elasticity of demand greater than 1.
B) is relatively less price elastic than D1.
C) is the inverse of the demand curve D1.
D) has a price elasticity of demand less than 1.
E) represents the demand of the group that is more responsive to price changes.
Correct Answer:

Verified
Correct Answer:
Verified
Q103: The figures given below represent the revenue
Q104: The table given below shows the price,
Q105: The figure given below shows the aggregate
Q106: The figure given below shows the aggregate
Q107: The figure given below shows the aggregate
Q109: The following table shows the marginal revenues
Q110: The table given below shows the price,
Q111: The table given below shows the prices
Q112: The figure given below shows the demand
Q113: The figure given below shows the cost