Multiple Choice
The figure given below shows the demand curves of two classes of buyers, for tickets to a football match.Figure 11.4
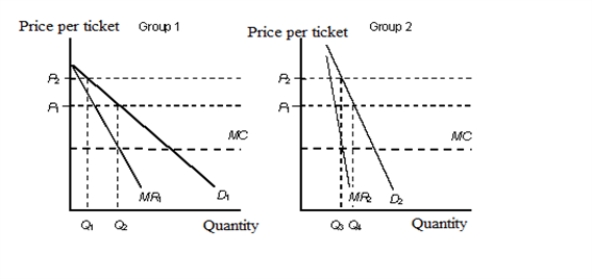 D1: Demand curve of group 1
D2: Demand curve of group 2
MR1: Marginal revenue of group 1
MR2: Marginal revenue of group 2
MC: Marginal cost
-Perfect price discrimination occurs when:
A) each customer is charged the maximum price that each is willing and able to pay.
B) two classes of customers are charged different prices as they have the same elasticities of demand.
C) senior citizens are offered restaurant discounts.
D) the firm sets MR < MC for each class of customers.
E) the firm charges same price to different customers so that it is equal to the equilibrium price.
Correct Answer:

Verified
Correct Answer:
Verified
Q39: The table given below shows the price,
Q40: The figure given below shows the cost
Q41: The figure given below shows the cost
Q42: The table given below shows the prices
Q43: The figure given below shows the cost
Q45: The table given below shows the price,
Q46: The figure given below shows the aggregate
Q47: The table given below shows the price
Q48: The figure given below shows the cost
Q49: The table given below shows the prices