Multiple Choice
The figure below shows the market equilibrium (point B) at the intersection of demand and supply curves under perfect competition.Figure 11.5
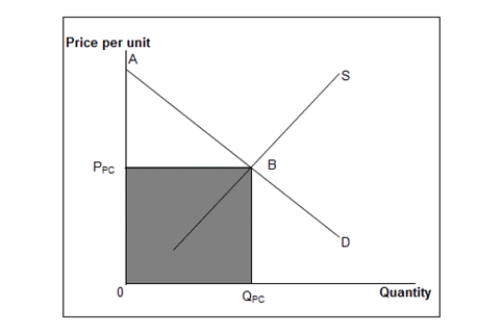 D: Market demand curve
S: Market supply curve
-Assume that in Figure 11.5, the market is originally perfectly competitive but then becomes a monopoly. Compared with perfect competition, a monopoly would have:
A) a price lower than PPC.
B) a quantity more than QPC.
C) a greater consumer surplus.
D) a deadweight loss.
E) a lower producer surplus.
Correct Answer:

Verified
Correct Answer:
Verified
Q74: The figure given below shows the demand
Q75: The figure given below shows the cost
Q76: The figure given below shows the cost
Q77: The figure given below shows the cost
Q78: The figures given below represent the revenue
Q80: The table given below shows the price
Q81: The following table shows the units of
Q82: The table given below shows the prices
Q83: The figure given below shows the aggregate
Q84: The figure given below shows the cost