Multiple Choice
The following figures show the demand and cost curves of a perfectly competitive firm and a monopoly respectively.Figure 11.7
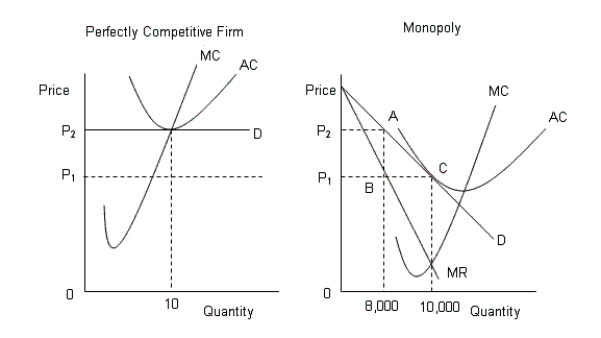 D: Average Revenue
AC: Average cost
MC: Marginal cost
MR: Marginal cost
-Why does an efficiency loss arise under monopoly rather than under perfect competition?
A) A monopolist charges a lower price for the product to gain market entry.
B) A monopolist sells a lesser quantity at a higher price.
C) There is a net increase in consumer surplus but a net decline in producer surplus.
D) There is an increase in producer surplus, consumer surplus remaining unchanged.
E) A monopolist sells a greater quantity than a perfect competitor.
Correct Answer:

Verified
Correct Answer:
Verified
Q97: The following table shows the units of
Q98: The figure given below shows the demand
Q99: The table given below shows the price,
Q100: The following figure shows the revenue curves
Q101: The figure given below shows the aggregate
Q103: The figures given below represent the revenue
Q104: The table given below shows the price,
Q105: The figure given below shows the aggregate
Q106: The figure given below shows the aggregate
Q107: The figure given below shows the aggregate