Multiple Choice
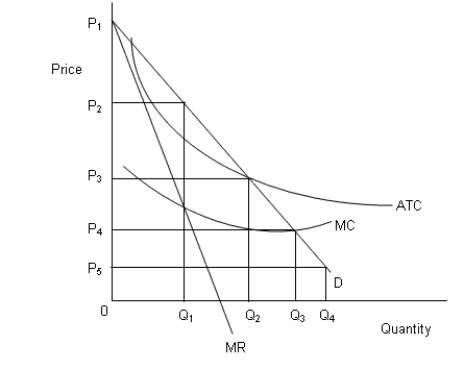
The figure below shows revenue and cost curves of a natural monopoly firm.Figure 14.1
 In the figure,
D: Demand curve
MR: Marginal revenue curve
MC: Marginal cost curve
ATC: Average total cost curve
-To avoid driving a natural monopolist into bankruptcy, regulatory commissions:
A) allow the monopolist to enjoy an economic profit.
B) do not allow the monopolist to make an accounting profit.
C) subsidize the monopolist to help it break even.
D) allow the monopolist to earn a fair rate of return.
E) allow the monopolist to temporarily shut down.
Correct Answer:

Verified
Correct Answer:
Verified
Q1: <img src="https://d2lvgg3v3hfg70.cloudfront.net/TB1748/.jpg" alt=" -The judicial doctrine,
Q2: The figure below shows revenue and cost
Q4: <img src="https://d2lvgg3v3hfg70.cloudfront.net/TB1748/.jpg" alt=" -Which of the
Q5: In the following figure, the first panel
Q6: <img src="https://d2lvgg3v3hfg70.cloudfront.net/TB1748/.jpg" alt=" -A market that
Q7: In the following figure, the first panel
Q8: <img src="https://d2lvgg3v3hfg70.cloudfront.net/TB1748/.jpg" alt=" -Which of the
Q9: In the following figure, the first panel
Q10: The figure below shows revenue and cost
Q11: In the following figure, the first panel