Multiple Choice
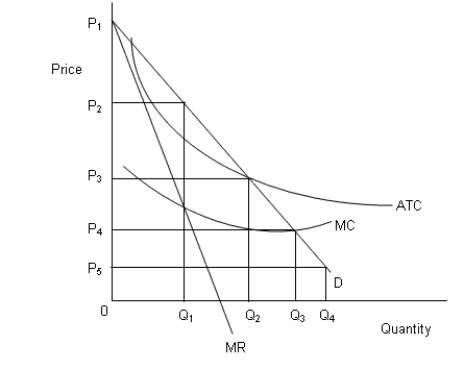
The figure below shows revenue and cost curves of a natural monopoly firm.Figure 14.1
 In the figure,
D: Demand curve
MR: Marginal revenue curve
MC: Marginal cost curve
ATC: Average total cost curve
-Which of the following is an example of the opportunity cost involved with social regulation?
A) The monetary costs of hiring administrative assistants to fill out OSHA safety reports
B) The environmental costs of pollution control required under the Clean Air Act
C) The monetary costs of laboratory trials required to try out a new drug
D) The lives that are lost because new drugs are not introduced quickly
E) The monetary cost of manufacturing a life saving drug
Correct Answer:

Verified
Correct Answer:
Verified
Q73: <img src="https://d2lvgg3v3hfg70.cloudfront.net/TB1748/.jpg" alt=" -Which of the
Q74: <img src="https://d2lvgg3v3hfg70.cloudfront.net/TB1748/.jpg" alt=" -Which of the
Q75: <img src="https://d2lvgg3v3hfg70.cloudfront.net/TB1748/.jpg" alt=" -One necessary step
Q76: The figure below shows revenue and cost
Q77: In the following figure, the first panel
Q79: In the following figure, the first panel
Q80: In the following figure, the first panel
Q81: <img src="https://d2lvgg3v3hfg70.cloudfront.net/TB1748/.jpg" alt=" -The antitrust laws
Q82: In the following figure, the first panel
Q83: In the following figure, the first panel