Multiple Choice
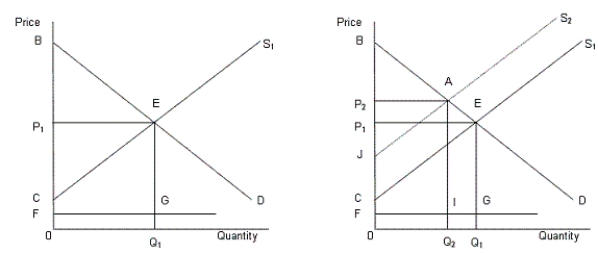
In the following figure, the first panel shows a market situation prior to regulation and the second panel shows the effects of regulation.Figure 14.2
 In the figure,
D: Demand curve for automobiles
S1: Supply curve of automobiles prior to regulation
S2: Supply curve of automobiles after regulation
FG: Clean up cost per unit
-Graphically, consumer surplus is the area:
A) above the demand curve.
B) below the supply curve.
C) under the demand curve and the supply curve.
D) above the market supply curve and under the equilibrium price.
E) under the market demand curve and above the equilibrium price.
Correct Answer:

Verified
Correct Answer:
Verified
Q41: In the following figure, the first panel
Q42: In the following figure, the first panel
Q43: In the following figure, the first panel
Q44: <img src="https://d2lvgg3v3hfg70.cloudfront.net/TB1748/.jpg" alt=" -Consider a market
Q45: In the following figure, the first panel
Q47: In the following figure, the first panel
Q48: <img src="https://d2lvgg3v3hfg70.cloudfront.net/TB1748/.jpg" alt=" -Most natural monopolies
Q49: <img src="https://d2lvgg3v3hfg70.cloudfront.net/TB1748/.jpg" alt=" -A market is
Q50: <img src="https://d2lvgg3v3hfg70.cloudfront.net/TB1748/.jpg" alt=" -Under George W.
Q51: In the following figure, the first panel