Multiple Choice
The figure given below depicts the demand and supply of Brazilian reals in the foreign exchange market. Assume that the market operates under a flexible exchange rate regime.Figure 22.1
In the figure:
D1 and D2: Demand for Brazilian reals
S1 and S2: Supply of Brazilian reals
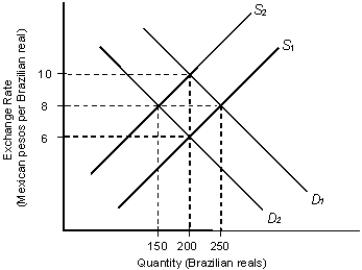
-Refer to Figure 22.1. If the initial equilibrium exchange rate is 6 pesos per real, then other things equal, a decrease in the number of Brazilian tourists to Mexico would:
A) increase the demand for Brazilian reals from D2 to D1 and increase the exchange rate to 8 pesos per real.
B) decrease the supply of Brazilian reals from S1 to S2 and increase the exchange rate to 8 pesos per real.
C) decrease the supply of Brazilian reals from S1 to S2 and increase the exchange rate to 10 pesos per real.
D) decrease the demand for Brazilian reals from D1 to D2 and increase the exchange rate to 8 pesos per real.
E) decrease the supply of Brazilian reals from S1 to S2 and increase the demand for Brazilian reals from D2 to D1, thereby changing the exchanging rate to 10 pesos per real.
Correct Answer:

Verified
Correct Answer:
Verified
Q79: The figure below shows the demand (D)
Q80: The figure given below depicts the foreign
Q81: The figure given below depicts the demand
Q82: The figure given below depicts the foreign
Q83: The figure below shows the demand (D)
Q85: The figure given below depicts the foreign
Q86: The figure given below depicts the foreign
Q87: The figure given below depicts the foreign
Q88: The figure below shows the demand (D)
Q89: The figure given below depicts the demand