Multiple Choice
The figure given below depicts the demand and supply of Brazilian reals in the foreign exchange market. Assume that the market operates under a flexible exchange rate regime.Figure 22.1
In the figure:
D1 and D2: Demand for Brazilian reals
S1 and S2: Supply of Brazilian reals
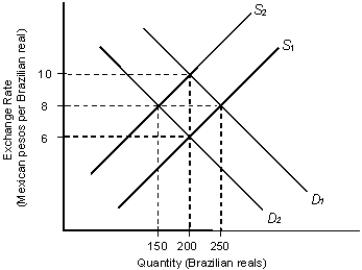
-Refer to Figure 22.1. The demand curves shown for Brazilian reals are based on:
A) the supply of Brazilian reals in the market.
B) the demand for Mexican pesos.
C) Brazilian demand for Brazilian products.
D) Brazilian demand for Mexican products.
E) Mexican demand for Brazilian products.
Correct Answer:

Verified
Correct Answer:
Verified
Q15: The figure given below depicts the foreign
Q16: The figure given below depicts the foreign
Q17: The figure below shows the demand (D)
Q18: The figure given below depicts the foreign
Q19: The figure below shows the demand (D)
Q21: The figure given below depicts the foreign
Q22: The figure given below depicts the foreign
Q23: The figure given below depicts the foreign
Q24: The figure given below depicts the foreign
Q25: The figure below shows the demand (D)