Multiple Choice
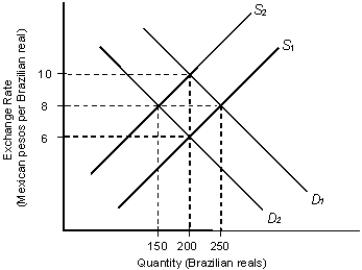
The figure given below depicts the demand and supply of Brazilian reals in the foreign exchange market. Assume that the market operates under a flexible exchange rate regime.Figure 22.1
In the figure:
D1 and D2: Demand for Brazilian reals
S1 and S2: Supply of Brazilian reals
-Suppose you observe that with a given supply curve, the Peruvian demand for Argentinean pesos steadily decreases. This will most likely mean:
A) the supply of Peruvian nuevos soles has increased on the foreign exchange market.
B) the Argentinean peso will appreciate in value relative to the Peruvian nuevo sol.
C) the Argentinean peso will depreciate in value relative to the Peruvian nuevo sol.
D) the Peruvian demand for Argentinean goods has increased.
E) the supply of Argentinean pesos has increased on the foreign exchange market.
Correct Answer:

Verified
Correct Answer:
Verified
Q99: The figure given below depicts the foreign
Q100: The figure given below depicts the foreign
Q101: The figure below shows the demand (D)
Q102: The figure below shows the demand (D)
Q103: The figure given below depicts the foreign
Q105: The figure below shows the demand (D)
Q106: The figure below shows the demand (D)
Q107: The figure given below depicts the foreign
Q108: The figure given below depicts the foreign
Q109: The figure below shows the demand (D)