Multiple Choice
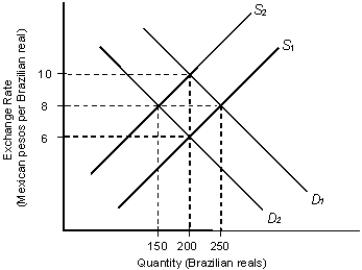
The figure given below depicts the demand and supply of Brazilian reals in the foreign exchange market. Assume that the market operates under a flexible exchange rate regime.Figure 22.1
In the figure:
D1 and D2: Demand for Brazilian reals
S1 and S2: Supply of Brazilian reals
-In 1991, the French mineral water Perrier was temporarily taken off the market in the United States because of suspected impurities. Other things equal, this action brought about:
A) an increase in the demand for Perrier.
B) a decrease in the price of Perrier in terms of French francs.
C) a depreciation of the French franc relative to the U.S. dollar.
D) an appreciation of the French franc relative to the U.S. dollar.
E) an increase in the supply of dollars in the foreign exchange market.
Correct Answer:

Verified
Correct Answer:
Verified
Q92: The figure below shows the demand (D)
Q93: The figure given below depicts the foreign
Q94: The figure given below depicts the foreign
Q95: The figure below shows the demand (D)
Q96: The figure given below depicts the foreign
Q98: The figure below shows the demand (D)
Q99: The figure given below depicts the foreign
Q100: The figure given below depicts the foreign
Q101: The figure below shows the demand (D)
Q102: The figure below shows the demand (D)