Multiple Choice
The figure given below depicts the foreign exchange market for British pounds traded for U.S. dollars.Figure 22.2
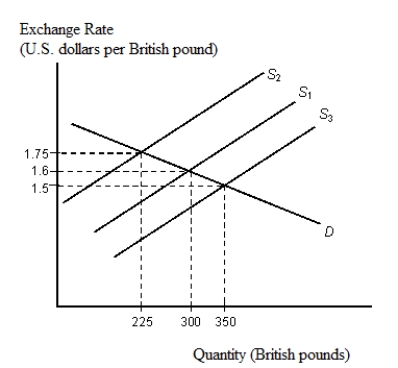
-Refer to Figure 22.2. An increase in the equilibrium quantity of British pounds from 300 to 350 would most likely mean that:
A) the demand for British pounds has decreased.
B) the supply of British pounds has decreased.
C) increased demand for dollars has caused the dollar to depreciate and the pound to appreciate.
D) increased demand for dollars has caused the dollar to appreciate and the pound to depreciate.
E) the equilibrium exchange rate is $1.60 per British pound.
Correct Answer:

Verified
Correct Answer:
Verified
Q71: The figure below shows the demand (D)
Q72: The figure given below depicts the foreign
Q73: The figure given below depicts the foreign
Q74: The figure given below depicts the foreign
Q75: The figure below shows the demand (D)
Q77: The figure given below depicts the foreign
Q78: The figure below shows the demand (D)
Q79: The figure below shows the demand (D)
Q80: The figure given below depicts the foreign
Q81: The figure given below depicts the demand