Multiple Choice
The 1999 and 2000 market share data of the three competitors (A,B,and C) in an oligopolistic industry are presented in the following pie charts.Total sales for this industry were $1.5 billion in 1999 and $1.8 billion in 2000.Company C's sales in 2000 were ___.
A) $342 million 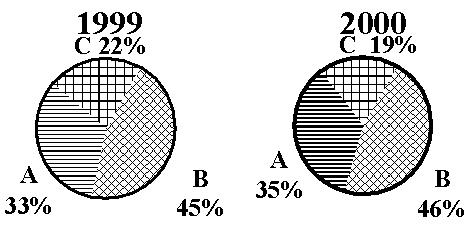
B) $630 million
C) $675 million
D) $828 million
E) $928 million
Correct Answer:

Verified
Correct Answer:
Verified
Q3: The cumulative frequency for a class is
Q9: The difference between the highest number and
Q26: Consider the following frequency distribution:
Q72: Consider the following stem and leaf plot:
Q72: The 1999 and 2000 market share data
Q78: A person has decided to construct a
Q86: Consider the following stem and leaf plot:
Q94: Pinky Bauer, Chief Financial Officer of
Q104: For any given data set, a frequency
Q110: Consider the relative frequency distribution given