Multiple Choice
The following graphic of residential housing data (selling price and size in square feet) is a ___. 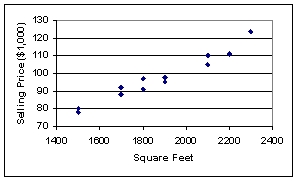
A) scatter plot
B) Pareto chart
C) pie chart
D) cumulative histogram
E) cumulative frequency distribution
Correct Answer:

Verified
Correct Answer:
Verified
Related Questions
Q14: Each day,the office staff at Oasis Quick
Q15: Display and analyze two variables simultaneously using
Q20: The 1999 and 2000 market share data
Q52: In a histogram,the tallest bar represents the
Q72: A scatter plot is useful for examining
Q79: Pinky Bauer, Chief Financial Officer of
Q82: For a company in gardening supplies business,the
Q87: Consider the following frequency distribution:
Q90: A person has decided to construct a
Q93: A frequency distribution was developed.The lower endpoint