Multiple Choice
The following graphic of residential housing data (selling price and size in square feet) indicates ___. 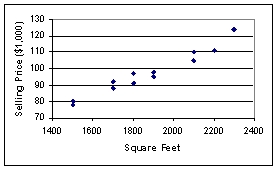
A) an inverse relation between the two variables
B) no relation between the two variables
C) a direct relation between the two variables
D) a negative exponential relation between the two variables
E) a sinusoidal relationship between the two variables
Correct Answer:

Verified
Correct Answer:
Verified
Q30: The following class intervals for a frequency
Q38: Explain the difference between grouped and ungrouped
Q39: The staff of Mr.Wayne Wertz,VP of Operations
Q40: Each day,the office staff at Oasis Quick
Q42: The staff of Mr.Wayne Wertz,VP of Operations
Q43: The staff of Mr.Wayne Wertz,VP of Operations
Q44: The following class intervals for a frequency
Q44: The staff of Mr.Wayne Wertz,VP of Operations
Q55: The number of phone calls arriving
Q56: If the individual class frequency is divided