Multiple Choice
The following graph of a time-series data suggests a ___ trend. 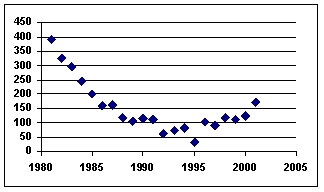
A) linear
B) tangential
C) cosine
D) quadratic
E) flat
Correct Answer:

Verified
Correct Answer:
Verified
Related Questions
Q11: One of the ways to overcome the
Q17: One of the ways to overcome the
Q53: Fitting a linear trend to 36 monthly
Q54: The forecast value for August was
Q55: A time series with forecast values and
Q58: Account for seasonal effects of time-series data
Q59: Using a three-month moving average,the forecast value
Q61: The ratios of "actuals to moving averages"
Q62: Jim Royo,manager of Billings Building Supply
Q96: Typically, the denominator used to calculate an