Multiple Choice
The following graph of a time-series data suggests a ___ trend. 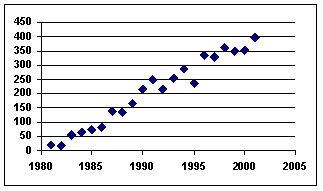
A) linear
B) quadratic
C) cosine
D) tangential
E) flat
Correct Answer:

Verified
Correct Answer:
Verified
Related Questions
Q28: Analysis of data for an autoregressive forecasting
Q30: Using a three-month moving average,the forecast value
Q33: Differentiate among simple index numbers,unweighted aggregate price
Q34: Jim Royo,manager of Billings Building Supply
Q35: Using a three-month moving average (with weights
Q36: A time series with forecast values and
Q74: Mean error (ME)and mean absolute deviation (MAD)will
Q76: Forecast error is the difference between the
Q78: Time-series data are data gathered on a
Q86: In an autoregressive forecasting model, the independent