Essay
Using the data shown below, compute the mean square error, mean absolute deviation, and mean absolute percentage error for the forecasts shown.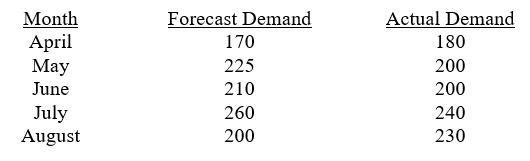
Correct Answer:

Verified
Mean square error = [(180 - 170)2View Answer
Unlock this answer now
Get Access to more Verified Answers free of charge
Correct Answer:
Verified
View Answer
Unlock this answer now
Get Access to more Verified Answers free of charge
Q6: In forecasting, irregular variation that is explainable
Q12: A single moving average is most appropriate
Q16: Define forecast error and describe ways that
Q17: Valentine's Day is the best day of
Q21: _ forecasts are needed to plan workforce
Q22: In an exponential smoothing model, larger values
Q25: Explain judgmental forecasting, including grass roots forecasting
Q32: Discuss the three planning horizons used in
Q45: Seasonal patterns can occur over the weeks
Q55: The Delphi method is a forecasting approach