Essay
Five samples were taken, with five observations each.The sample findings are listed below.The sample values represent service times in minutes.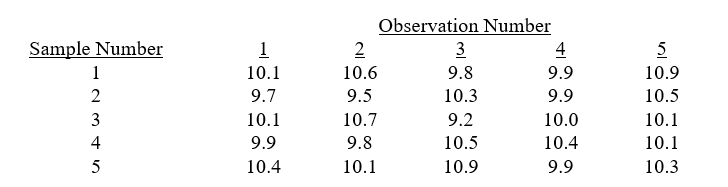
a.Determine the control limits for the R-chart.
b.Would you conclude the R-chart is in statistical control and proceed to develop the x-bar chart?
Correct Answer:

Verified
a.R1 = 1.1, R2 = 1...View Answer
Unlock this answer now
Get Access to more Verified Answers free of charge
Correct Answer:
Verified
View Answer
Unlock this answer now
Get Access to more Verified Answers free of charge
Q45: Fifteen samples of size 5 have been
Q53: What is the purpose of a process
Q54: Which is not related to a discrete
Q56: A c-chart is used to monitor the
Q57: Testing whether a computer boots up the
Q61: In developing process control charts, if special
Q63: A high-paced discount store in Los Angeles
Q64: Quality control focuses on the design of
Q75: A production process is sampled 24 times
Q84: It is not necessary to have a