Multiple Choice
This graph shows the feasible region defined by points ACDEF) and objective function level curve BG) for a maximization problem.Which point corresponds to the optimal solution to the problem? 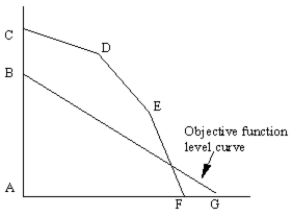
A) A
B) B
C) C
D) D
E) E
Correct Answer:

Verified
Correct Answer:
Verified
Related Questions
Q13: A diet is being developed which must
Q22: The following linear programming problem has been
Q25: The Byte computer company produces two
Q27: The following diagram shows the constraints for
Q28: If a problem has infinite number solutions,
Q28: A facility produces two products.The labor constraint
Q31: A production optimization problem has 4 decision
Q70: Level curves are used when solving LP
Q74: The second step in formulating a linear
Q75: When do alternate optimal solutions occur in