Essay
Exhibit 9.3
The following questions are based on the problem description and spreadsheet below.
A researcher is interested in determining how many calories young men consume. She measured the age of the individuals and recorded how much food they ate each day for a month. The average daily consumption was recorded as the dependent variable. She has developed the following Excel spreadsheet of the results. 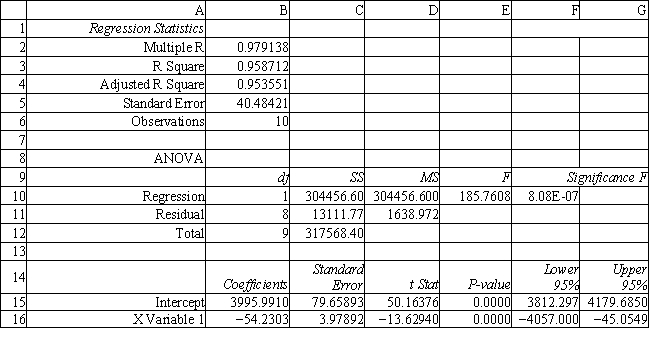
-Refer to Exhibit 9.3. Interpret the meaning of R square in cell B3 of the spreadsheet.
Correct Answer:

Verified
The R Square value of 0. 95871...View Answer
Unlock this answer now
Get Access to more Verified Answers free of charge
Correct Answer:
Verified
View Answer
Unlock this answer now
Get Access to more Verified Answers free of charge
Q11: The R<sup>2</sup> statistic (also referred to
Q12: Exhibit 9.1<br>The following questions are based on
Q13: Based on the following regression output, what
Q14: Exhibit 9.2<br>The following questions are based on
Q15: The regression function indicates the<br>A) average value
Q17: The standard error measures the<br>A) variability in
Q18: A residual is defined as the difference
Q19: Exhibit 9.7<br>The partial regression output below applies
Q20: In regression terms what does "best fit"
Q21: The problem of finding the optimal values