Multiple Choice
Exhibit 10.1
The following questions are based on the problem description and the output below.
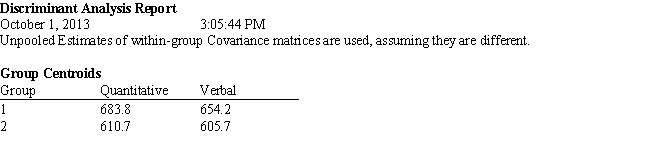
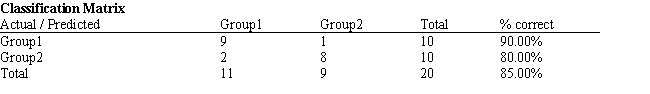
A college admissions officer wants to evaluate graduate school applicants based on their GMAT scores, verbal and quantitative. Students are classified as either successful or not-successful in their graduate studies. The officer has data on 20 current students, ten of whom are doing very well (Group 1) and ten who are not (Group 2) . 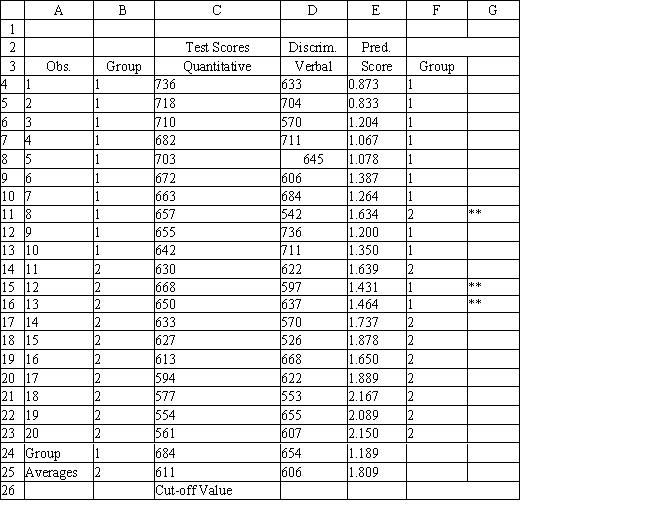
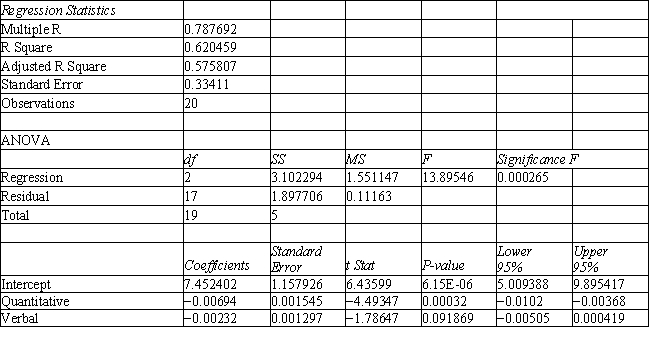
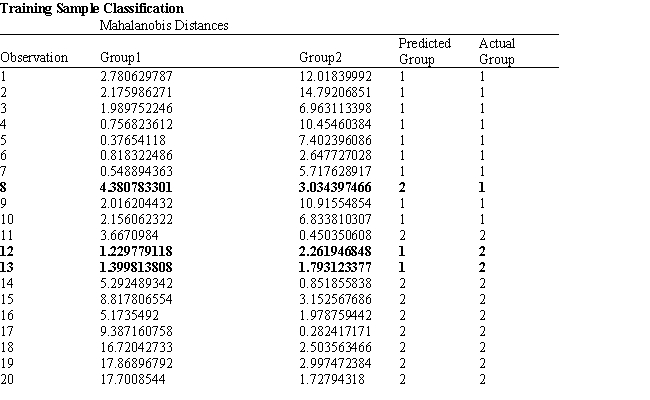
-Refer to Exhibit 10.1. The university has received applications from several new students and would like to predict which group they would fall into. What is the discriminant score for a student with a Quantitative score of 686 and a Verbal score of 601. Use five (5) significant figures in your coefficients.
A) 1.29 ≤ discriminant score ≤ 1.30
B) 1.69 ≤ discriminant score ≤ 1.70
C) 2.69 ≤ discriminant score ≤ 2.70
D) 6.05 ≤ discriminant score ≤ 6.06
Correct Answer:

Verified
Correct Answer:
Verified
Q67: Suppose that the correlation coefficient between X<sub>1</sub>
Q115: Exhibit 10.2<br>The following questions are based on
Q116: Cluster analysis is a data mining technique
Q117: Which of the following is not true
Q118: Exhibit 10.2<br>The following questions are based on
Q120: Given the following confusion matrix <img src="https://d2lvgg3v3hfg70.cloudfront.net/TB2300/.jpg"
Q121: Exhibit 10.2<br>The following questions are based on
Q122: Exhibit 10.5<br>The information below is used for
Q123: If using the regression tool for two-group
Q124: Exhibit 10.6<br>The information below is used for