Multiple Choice
Exhibit 11.10
The following questions use the data below.
Joe's Sporting Goods wants to forecast quarterly sales figures using a quadratic trend model. The store has collected 12 quarters of data and needs your help to analyze the data. The relevant regression output is in the following table. 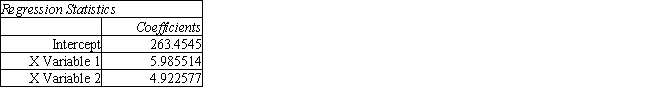
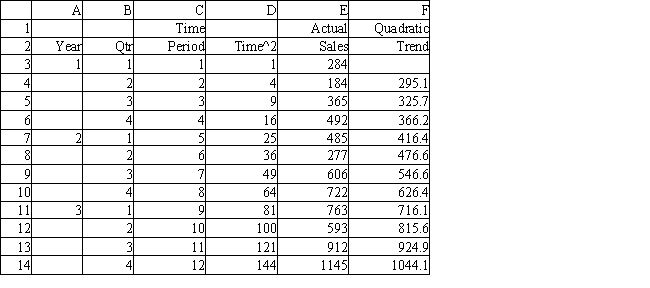
-Refer to Exhibit 11.10. What are predicted sales for the fourth quarter of year 4?
A) 1170 ≤ predicted sales < 1175
B) 1310 ≤ predicted sales < 1315
C) 1460 ≤ predicted sales < 1465
D) 1615 ≤ predicted sales < 1620
Correct Answer:

Verified
Correct Answer:
Verified
Q60: Exhibit 11.1<br>The following questions use the data
Q61: Exhibit 11.18<br>The following questions use the data
Q62: A technique that analyzes past behavior of
Q63: Exhibit 11.23<br>The following questions use the data
Q64: Exhibit 11.5<br>The following questions use the data
Q66: Seasonality in a time series is indicated
Q67: Exhibit 11.1<br>The following questions use the data
Q68: The determination of the MSE-minimizing value of
Q69: A time series is a set of
Q70: The correct formula for a k period