Multiple Choice
Exhibit 11.11
The following questions use the data below.
Joe's Sporting Goods wants to forecast quarterly sales figures using seasonal indices. The store has collected 12 quarters of data and needs your help to analyze the data. The relevant regression output is in the following table. 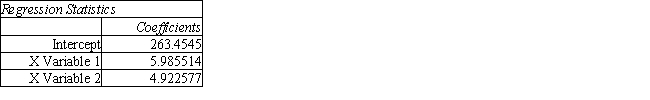
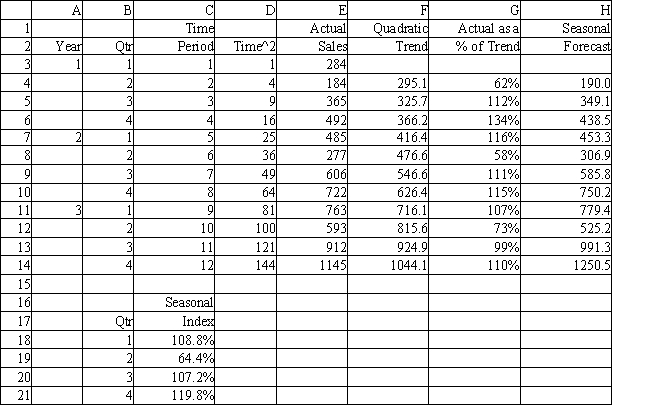
-Refer to Exhibit 11.11. What formula should be entered in cell F3 to compute the quadratic trend for year 1 Quarter 1?
A) = 263.4545 * C3 + 5.985514 * D3 + 4.922577
B) = 263.4545 + 5.985514 * D3 + 4.922577 * C3
C) = 263.4545 + 5.985514 * C2 + 4.922577 * D2
D) = 263.4545 + 5.985514 * C3 + 4.922577 * D3
Correct Answer:

Verified
Correct Answer:
Verified
Q115: Exhibit 11.7<br>The following questions use the data
Q116: Exhibit 11.12<br>The following questions use the data
Q117: Exhibit 11.11<br>The following questions use the data
Q118: Exhibit 11.22<br>The following questions use the data
Q119: The correct formula for the weighted moving
Q120: Exhibit 11.10<br>The following questions use the data
Q121: Exhibit 11.5<br>The following questions use the data
Q122: Exhibit 11.7<br>The following questions use the data
Q124: Which of the following describes an additive
Q125: Exhibit 11.10<br>The following questions use the data