Multiple Choice
Figure 1-1 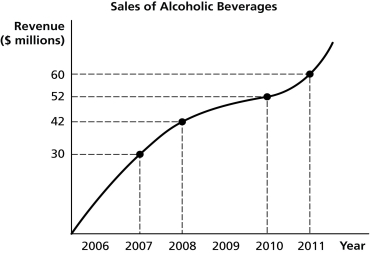
-Refer to Figure 1-1. Using the information in the figure above, calculate the percentage change in sales of alcoholic beverages between 2008 and 2011.
A) 23.1%
B) 23.8%
C) 30%
D) 42.9%
Correct Answer:

Verified
Correct Answer:
Verified
Q18: What is a marginal benefit?
Q41: Lionel's Lawn Care is a company that
Q43: Table 1-2<br> <img src="https://d2lvgg3v3hfg70.cloudfront.net/TB4188/.jpg" alt="Table 1-2
Q44: Scenario 1-2<br>Suppose a hat manufacturer currently sells
Q107: One example of human capital is the
Q116: The cost incurred from the production of
Q140: Every society faces trade-offs.Explain the concept of
Q143: Which of the following are positive economic
Q147: Voluntary exchange increases economic efficiency<br>A)because neither the
Q205: One desirable outcome of a market economy