Multiple Choice
Figure 1-1 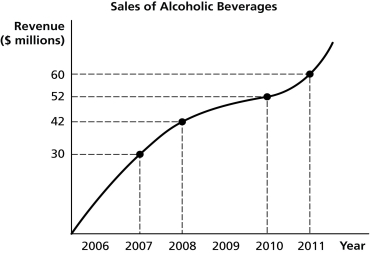
-Refer to Figure 1-1. Using the information in the figure above, calculate the percentage change in sales of alcoholic beverages between 2007 and 2011.
A) 30%
B) 50%
C) 66.7%
D) 100%
Correct Answer:

Verified
Correct Answer:
Verified
Q1: Which of the following is motivated by
Q25: The prevalence of Alzheimer's dementia is very
Q74: The relationship between consumer spending and disposable
Q97: The study of economics arises due to<br>A)money.<br>B)scarcity.<br>C)greed.<br>D)resources.
Q159: Tabitha shares a flea market booth with
Q176: Markets promote<br>A)equity and competition.<br>B)voluntary exchange and equality.<br>C)equity
Q186: Allocative efficiency is achieved when<br>A)goods and services
Q202: Pookie's Pinball Palace restores old Pinball machines.Pookie
Q208: Which of the following is part of
Q230: Which of the following statements is true