Multiple Choice
Figure 3-1 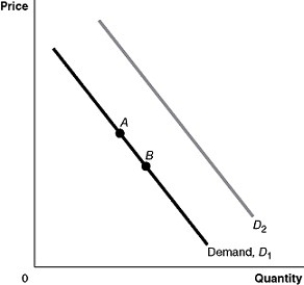
-Refer to Figure 3-1. A decrease in taste or preference would be represented by a movement from
A) A to B.
B) B to A.
C) D1 to D2.
D) D2 to D1.
Correct Answer:

Verified
Correct Answer:
Verified
Related Questions
Q44: Market equilibrium occurs where the quantity supplied
Q50: If, in response to an increase in
Q96: An inferior good is a good for
Q119: For each of the following pairs of
Q143: If the demand curve for a product
Q155: Assume that the demand curve for DVD
Q171: What are the five most important variables
Q181: In response to a shortage,the market price
Q188: If the price of propane-fueled gas grills
Q222: If the price of automobiles was to