Multiple Choice
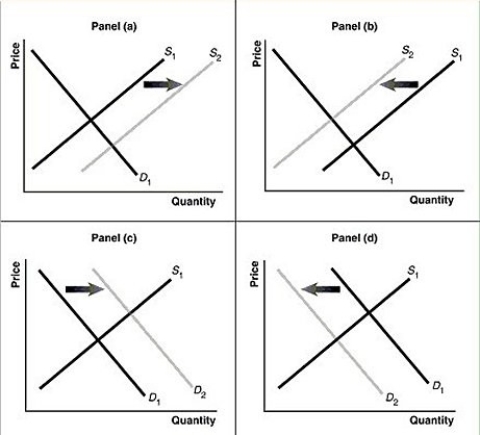
Figure 3-7

-Refer to Figure 3-7.Assume that the graphs in this figure represent the demand and supply curves for potatoes and that steak and potatoes are complements.What panel describes what happens in this market when the price of steak rises?
A) Panel (a)
B) Panel (b)
C) Panel (c)
D) Panel (d)
Correct Answer:

Verified
Correct Answer:
Verified
Q123: The _ effect refers to the change
Q124: Figure 3-6<br> <img src="https://d2lvgg3v3hfg70.cloudfront.net/TB4193/.jpg" alt="Figure 3-6
Q125: Select the phrase that correctly completes the
Q126: If an increase in income leads to
Q127: If a demand curve shifts to the
Q129: Discuss the correct and incorrect economic analysis
Q130: If more insurance companies decide to cover
Q131: If a decrease in income leads to
Q132: If the United States placed an embargo
Q133: An inferior good is a good for