Multiple Choice
Figure 3-8 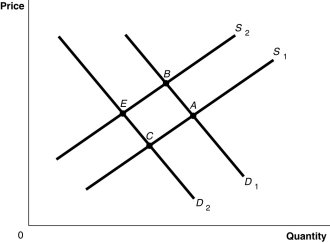
-Refer to Figure 3-8.The graph in this figure illustrates an initial competitive equilibrium in the market for sugar at the intersection of D1 and S1 (point A) .If there is an increase in the price of fertilizer used on sugar cane and there is a decrease in tastes for sugar-sweetened soft drinks,how will the equilibrium point change?
A) The equilibrium point will move from A to B.
B) The equilibrium point will move from A to C.
C) There will be no change in the equilibrium point.
D) The equilibrium point will move from A to E.
Correct Answer:

Verified
Correct Answer:
Verified
Q16: An increase in the price of inputs
Q38: Positive technological change in the production of
Q48: Quantity supplied refers to the amount of
Q181: Suppose a negative technological change in the
Q190: All else equal, the decrease in consumer
Q192: In a perfectly competitive market, there are
Q208: What is the difference between a supply
Q209: Orange juice drinkers want to consume more
Q218: If, in response to an increase in
Q249: Let D = demand, S = supply,