Multiple Choice
Figure 3-8 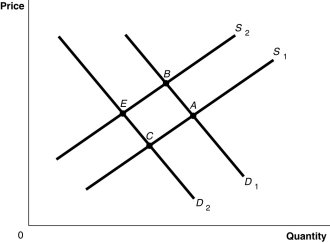
-Refer to Figure 3-8.The graph in this figure illustrates an initial competitive equilibrium in the market for apples at the intersection of D2 and S1 (point C) .Which of the following changes would cause the equilibrium to change to point B?
A) a positive change in the technology used to produce apples and a decrease in the price of oranges,a substitute for apples
B) an increase in the wages of apple workers and an increase in the price of oranges,a substitute for apples
C) an increase in the number of apple producers and a decrease in the number of apple trees as a result of disease
D) a decrease in the wages of apple workers and an increase in the price of oranges,a substitute for apples
Correct Answer:

Verified
Correct Answer:
Verified
Q29: Suppose that when the price of raspberries
Q37: If a firm has an incentive to
Q59: If consumers believe the price of LCD
Q79: An increase in the number of firms
Q88: A(n)_ is represented by a leftward shift
Q136: Select the phrase that correctly completes the
Q146: What is the ceteris paribus condition?
Q154: Figure 3-8 <img src="https://d2lvgg3v3hfg70.cloudfront.net/TB4181/.jpg" alt="Figure 3-8
Q168: Figure 3-6 <img src="https://d2lvgg3v3hfg70.cloudfront.net/TB4188/.jpg" alt="Figure 3-6
Q352: Figure 3-2 <img src="https://d2lvgg3v3hfg70.cloudfront.net/TB7397/.jpg" alt="Figure 3-2