Multiple Choice
Figure 5.1 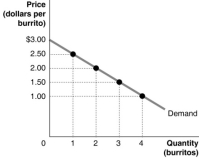 Figure 5.1 shows Arnold's demand curve for burritos.
-Refer to Figure 5.1.If the market price is $1.50, what is the consumer surplus on the second burrito?
A) $0.50
B) $1.00
C) $1.50
D) $3.50
Correct Answer:

Verified
Correct Answer:
Verified
Q8: If the quantity of soccer balls demanded
Q78: Figure 5.1 <img src="https://d2lvgg3v3hfg70.cloudfront.net/TB1015/.jpg" alt="Figure 5.1
Q79: Table 5.4 <img src="https://d2lvgg3v3hfg70.cloudfront.net/TB1015/.jpg" alt="Table 5.4
Q80: Which of the following is true in
Q81: Table 5.1 <img src="https://d2lvgg3v3hfg70.cloudfront.net/TB1015/.jpg" alt="Table 5.1
Q83: Figure 5.1 <img src="https://d2lvgg3v3hfg70.cloudfront.net/TB1015/.jpg" alt="Figure 5.1
Q84: What is the difference between the highest
Q85: Table 5.7 <img src="https://d2lvgg3v3hfg70.cloudfront.net/TB1015/.jpg" alt="Table 5.7
Q108: Consumer surplus is the difference between the
Q111: If marginal benefit is greater than marginal