Multiple Choice
Figure 5.1 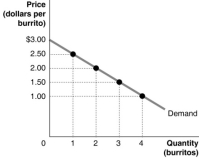 Figure 5.1 shows Arnold's demand curve for burritos.
-Refer to Figure 5.1.If the market price is $2.00, what is the consumer surplus on the second burrito?
A) $0
B) $1.00
C) $2.00
D) $4.50
Correct Answer:

Verified
Correct Answer:
Verified
Q19: Figure 5.5 <img src="https://d2lvgg3v3hfg70.cloudfront.net/TB1015/.jpg" alt="Figure 5.5
Q20: Figure 5.9 <img src="https://d2lvgg3v3hfg70.cloudfront.net/TB1015/.jpg" alt="Figure 5.9
Q25: Figure 5.4 <img src="https://d2lvgg3v3hfg70.cloudfront.net/TB1015/.jpg" alt="Figure 5.4
Q27: Figure 5.5 <img src="https://d2lvgg3v3hfg70.cloudfront.net/TB1015/.jpg" alt="Figure 5.5
Q54: The excess burden of a tax is
Q57: Rent control is an example of a
Q60: Suppose an excise tax of $1 is
Q103: A price ceiling is a legally determined
Q120: The total amount of consumer surplus in
Q129: The following equations represent the demand and