Multiple Choice
Figure 5.1 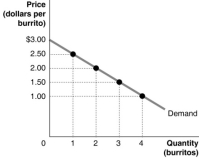 Figure 5.1 shows Arnold's demand curve for burritos.
-Refer to Figure 5.1.If the market price is $3.00, what is the maximum number of burritos that Arnold will buy?
A) 0
B) 2
C) 3
D) 4
Correct Answer:

Verified
Correct Answer:
Verified
Q1: Table 5.3 <img src="https://d2lvgg3v3hfg70.cloudfront.net/TB1015/.jpg" alt="Table 5.3
Q2: Table 5.7 <img src="https://d2lvgg3v3hfg70.cloudfront.net/TB1015/.jpg" alt="Table 5.7
Q4: Figure 5.3 <img src="https://d2lvgg3v3hfg70.cloudfront.net/TB1015/.jpg" alt="Figure 5.3
Q5: Table 5.1 <img src="https://d2lvgg3v3hfg70.cloudfront.net/TB1015/.jpg" alt="Table 5.1
Q6: If the market price is at equilibrium,
Q7: Figure 5.1 <img src="https://d2lvgg3v3hfg70.cloudfront.net/TB1015/.jpg" alt="Figure 5.1
Q9: Table 5.4 <img src="https://d2lvgg3v3hfg70.cloudfront.net/TB1015/.jpg" alt="Table 5.4
Q41: What area on a supply and demand
Q88: What do economists mean by an efficient
Q119: The division of the burden of a