Essay
The graph below represents the market for lychee nuts.The equilibrium price is $7.00 per bushel,but the market price is $5.00 per bushel.Identify the areas representing consumer surplus,producer surplus,and deadweight loss at the equilibrium price of $7.00 and at the market price of $5.00. 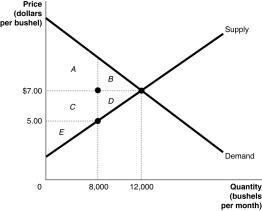
Correct Answer:

Verified
At the equilibrium price of $7.00:
Consu...View Answer
Unlock this answer now
Get Access to more Verified Answers free of charge
Correct Answer:
Verified
Consu...
View Answer
Unlock this answer now
Get Access to more Verified Answers free of charge
Q41: What area on a supply and demand
Q60: Suppose an excise tax of $1 is
Q63: Table 5.6 <img src="https://d2lvgg3v3hfg70.cloudfront.net/TB1015/.jpg" alt="Table 5.6
Q111: If marginal benefit is greater than marginal
Q118: Table 5.2 <img src="https://d2lvgg3v3hfg70.cloudfront.net/TB1015/.jpg" alt="Table 5.2
Q119: The division of the burden of a
Q128: Table 5.3 <img src="https://d2lvgg3v3hfg70.cloudfront.net/TB1015/.jpg" alt="Table 5.3
Q139: What is a black market?
Q160: A _ curve shows the marginal cost
Q170: Figure 5.4 <img src="https://d2lvgg3v3hfg70.cloudfront.net/TB1015/.jpg" alt="Figure 5.4