Multiple Choice
Table 5.4 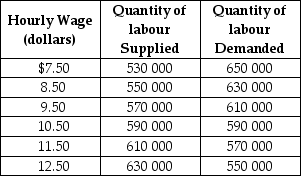 Table 5-4 shows the demand and supply schedules for labour market in the city of Pixley.
-Refer to Table 5.4.Suppose that the quantity of labour demanded increases by 40 000 at each wage level.What are the new free market equilibrium hourly wage and the new equilibrium quantity of labour?
A) W = $8.50; Q = 550 000
B) W = $12.50; Q = 630 000
C) W = $9.50; Q = 570 000
D) W = $11.50; Q = 610 000
Correct Answer:

Verified
Correct Answer:
Verified
Q64: Which of the following statements is true?<br>A)Consumer
Q65: Figure 5.1 <img src="https://d2lvgg3v3hfg70.cloudfront.net/TB1015/.jpg" alt="Figure 5.1
Q66: Table 5.6 <img src="https://d2lvgg3v3hfg70.cloudfront.net/TB1015/.jpg" alt="Table 5.6
Q68: Figure 5.5 <img src="https://d2lvgg3v3hfg70.cloudfront.net/TB1015/.jpg" alt="Figure 5.5
Q70: Figure 5.10 <img src="https://d2lvgg3v3hfg70.cloudfront.net/TB1015/.jpg" alt="Figure 5.10
Q72: Figure 5.7 <img src="https://d2lvgg3v3hfg70.cloudfront.net/TB1015/.jpg" alt="Figure 5.7
Q93: In cities with rent controls, the actual
Q109: Marginal benefit is equal to the _
Q110: What is producer surplus? What does producer
Q140: In order to be binding, a price