menu-iconExamlexExamLexServices

Discover

Ask a Question
  1. All Topics
  2. Topic
    Business
  3. Study Set
    Microeconomics Study Set 18
  4. Exam
    Exam 7: Technology, Production and Costs
  5. Question
    Fill in the Missing Values in the Following Table
Solved

Fill in the Missing Values in the Following Table

Question 165

Question 165

Essay

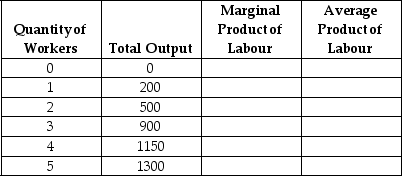
Fill in the missing values in the following table.Draw one graph showing how total output increases with the quantity of workers hired,and another graph showing the marginal product of labour and the average product of labour.

Correct Answer:

verifed

Verified

Unlock this answer now
Get Access to more Verified Answers free of charge

Related Questions

Q34: Is it possible for technological change to

Q102: Marginal cost is calculated for a particular

Q102: <img src="https://d2lvgg3v3hfg70.cloudfront.net/TB4183/.jpg" alt=" -Refer to Figure

Q156: Table 7.8 <img src="https://d2lvgg3v3hfg70.cloudfront.net/TB1015/.jpg" alt="Table 7.8

Q177: <img src="https://d2lvgg3v3hfg70.cloudfront.net/TB4183/.jpg" alt=" -Refer to Figure

Q187: Which of the following statements regarding a

Q201: Diseconomies of scale occur when<br>A) long-run average

Q237: <img src="https://d2lvgg3v3hfg70.cloudfront.net/TB4183/.jpg" alt=" -Refer to Figure

Q241: Assume that you observe the long-run average

Q257: If average product is decreasing, then marginal

Examlex

ExamLex

About UsContact UsPerks CenterHomeschoolingTest Prep

Work With Us

Campus RepresentativeInfluencers

Links

FaqPricingChrome Extension

Download The App

Get App StoreGet Google Play

Policies

Privacy PolicyTerms of ServiceHonor CodeCommunity Guidelines

Scan To Download

qr-code

Copyright © (2025) ExamLex LLC.

Privacy PolicyTerms Of ServiceHonor CodeCommunity Guidelines