Multiple Choice
Figure 7.11 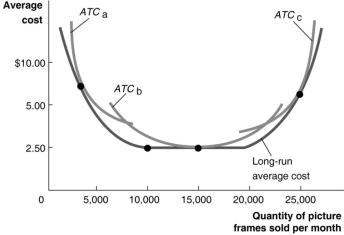 Figure 7.11 illustrates the long-run average cost curve for a firm that produces picture frames.The graph also includes short-run average cost curves for three firm sizes: ATCa, ATCb and ATCc.
-Refer to Figure 7.11.For output rates greater than 20 000 picture frames per month,
A) the firm will not make a profit because the average cost of production will be too high.
B) the firm will experience diseconomies of scale.
C) the firm will experience diminishing returns.
D) the short-run average total cost will equal the long-run average total cost of production.
Correct Answer:

Verified
Correct Answer:
Verified
Q46: Suppose two countries use different combinations of
Q47: If a firm produces 20 units of
Q48: Which of the following is a fixed
Q51: One reason why, in the short run,
Q52: Table 7.1 <img src="https://d2lvgg3v3hfg70.cloudfront.net/TB1015/.jpg" alt="Table 7.1
Q54: Table 7.3 <img src="https://d2lvgg3v3hfg70.cloudfront.net/TB1015/.jpg" alt="Table 7.3
Q170: Average total cost is equal to<br>A)average fixed
Q172: If marginal cost is above the average
Q288: Accounting costs exclude implicit costs.
Q295: On an isoquant/isocost graph, the least cost