Multiple Choice
Figure 7.11 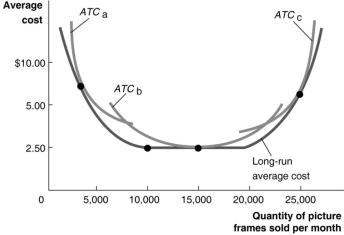 Figure 7.11 illustrates the long-run average cost curve for a firm that produces picture frames.The graph also includes short-run average cost curves for three firm sizes: ATCa, ATCb and ATCc.
-Refer to Figure 7.11.In the short run, if the firm sells fewer than 5000 picture frames per month,
A) it should produce with the scale of operation associated with ATCa.
B) it should produce with the scale of operation associated with ATCb.
C) it should produce with the scale of operation associated with ATCc.
D) it will experience constant returns to scale.
Correct Answer:

Verified
Correct Answer:
Verified
Q87: Which of the following statements is false?<br>A)An
Q131: If diminishing marginal returns have already set
Q136: If a firm decreases its plant size
Q137: Figure 7.11 <img src="https://d2lvgg3v3hfg70.cloudfront.net/TB1015/.jpg" alt="Figure 7.11
Q138: Table 7.6 <img src="https://d2lvgg3v3hfg70.cloudfront.net/TB1015/.jpg" alt="Table 7.6
Q139: In the short run, marginal product of
Q140: Figure 7.13 <img src="https://d2lvgg3v3hfg70.cloudfront.net/TB1015/.jpg" alt="Figure 7.13
Q213: The change in a firm's total cost
Q279: If average total cost is falling, marginal
Q310: Minimum efficient scale is defined as the